SQL Server
 http://www.brentozar.com/archive/2008/09/finding-your-san-bottlenecks-with-sqlio/
  Storage is a black box, right? The SAN admins ask how much storage space you need, you tell them, and then they give it to you. They don’t tell you how fast (or slow) it is, they don’t know whether it meets your needs, and they probably don’t know where the bottlenecks are.
It’s time to find out how fast your storage really is using SQLIO – perhaps the worst-named tool in history. SQLIO has absolutely nothing to do with SQL Server – it’s just a tool to test IO. Whether you’re an Exchange guy, a SQL DBA, or a file & print fella, SQLIO will help you push your storage to the limit to see when it breaks.
STEP 1: DOWNLOAD SQLIO FROM MICROSOFT FOR FREE
Download SQLIO from Microsoft and install it on the Windows server you’d like to test. It’s extremely lightweight – it takes less than 1MB on disk – and works on any version of Windows. The support page doesn’t say Windows 2008, but it works fine.
Install it in c:\Program Files no matter what drive you want to test. I prefer installing it in C because I delete and recreate my non-system partitions repeatedly while I’m testing them. That way, I can find out if various parameters are faster or slower without reinstalling the OS.
After installing SQLIO, you won’t see anything in the Start menu because it doesn’t have a graphical user interface. Deep calming breaths – this is easier than it looks. Fire open Windows Explorer and go into the directory where you installed SQLIO, like c:\Program Files(x86)\SQLIO.
STEP 2: SET UP SQLIO’S CONFIGURATION FILES
If you just start running SQLIO, it uses a laughably small 8MB test file by default. The problem with such a small test file is that it’s probably smaller than the cache involved in your various storage components (drives, storage processor, etc.) I prefer using a 20GB testing file for starters. Your SAN might have a larger cache, but keep in mind that it divides that cache across all of the servers connected to the SAN.
To create a larger file, we need to edit the param.txt text file in the directory where you installed SQLIO. If you’re using Windows 2008 R2 or newer, this file is protected by the OS, so we need to start Notepad as Administrator first. Go into Start, Program Files, Accessories, and then right-click Notepad and click Run As Administrator. Then open the param.txt file where you installed SQLIO.

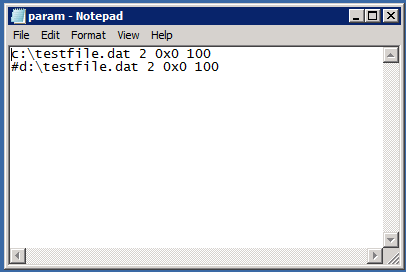
Param.txt
The c:\testfile.dat is the name of the test file that will be created. Change that to be whatever drive you want to test, like e:\testfile.dat.
The last parameter (100 by default) is the test file size in megabytes. To get a 20GB test file, replace 100 with 20480. Your end result will look like this if you want to test the E drive:
e:\testfile.dat 2 0x0 20480
#d:\testfile.dat 2 0x0 100
You can ignore the second line since we’ll only be working with one test file at a time. The # at the beginning means it’s commented out.
Save the file, but don’t close Notepad yet. While you’re in there, click File, New, and let’s create a couple of batch files to run SQLIO lots of times with different parameters. Copy/paste these lines into Notepad:
sqlio -kW -t8 -s120 -o8 -frandom -b8 -BH -LS E:\TestFile.dat
sqlio -kR -t8 -s120 -o8 -frandom -b8 -BH -LS E:\TestFile.dat
sqlio -kW -t8 -s120 -o8 -fsequential -b64 -BH -LS E:\TestFile.dat
sqlio -kR -t8 -s120 -o8 -fsequential -b64 -BH -LS E:\TestFile.dat
Save this in the SQLIO directory as test.bat.
WHAT DO THE SQLIO PARAMETERS MEAN?
While we’re looking at that set of commands, here’s a quick breakdown:
You’ll notice I’m using a lot of general terms here about how some application patterns work. Every SQL Server database has its own access patterns – random, sequential, big chunks, small pieces, and so on. The four test lines you see above are shorthand examples of how some SQL Server IO patterns work. We’re going to run a quick 4-part test first, and then come back to run much more in-depth tests shortly.
STEP 3: TEST THE DISK PERFORMANCE
Go to a Command Prompt (as administrator – yay, Windows) in the SQLIO directory and type:
sqlio -kW -s10 -fsequential -t8 -o8 -b8 -LS -Fparam.txt timeout /T 10
This will do a fast 10-second test, but more importantly it’ll create the test file using the file location and size parameters you specified in param.txt. The first time you run it for a given drive, it’s going to be dead slow – it’s going to warn you that it has to create the test file. Depending on your storage speed, this could take 15-20 minutes. Once the test file creation is done, the subsequent tests will go much, much faster. You can ignore the output of the above statement (as long as it’s not errors) and then type:
test.bat
This fires off the four-line test file.
STEP 4: HOW TO INTERPRET THE SQLIO RESULTS
SQLIO results look like this:
C:\Program Files (x86)\SQLIO>sqlio -kW -t8 -s120 -o8 -frandom -b8 -BH -LS -Fparam.txt
sqlio v1.5.SG
using system counter for latency timings, 3579545 counts per second
parameter file used: param.txt
 file e:\testfile.dat with 2 threads (0-1) using mask 0x0 (0)
2 threads writing for 120 secs to file e:\testfile.dat
 using 8KB random IOs
 enabling multiple I/Os per thread with 8 outstanding
 buffering set to use hardware disk cache (but not file cache)
using specified size: 20480 MB for file: e:\testfile.dat
initialization done
CUMULATIVE DATA:
throughput metrics:
IOs/sec:  1580.91
MBs/sec:    12.35
latency metrics:
Min_Latency(ms): 0
Avg_Latency(ms): 9
Max_Latency(ms): 2927
histogram:
ms: 0  1  2  3  4  5  6  7  8  9 10 11 12 13 14 15 16 17 18 19 20 21 22 23 24+
%:  0 19 62 14  2  1  0  0  0  0  0  0  0  0  0  0  0  0  0  0  0  0  0  0  2
I’ve bolded the most important numbers above. IOs/sec are the number of operations performed per second. Storage guys call this IOPs. MBs/sec are how much data moved around per second. Storage guys call this throughput.
The histogram at the bottom shows how fast the storage responded in milliseconds. Generally the numbers will either be all the way over to the left (0-3ms) or all the way over to the right (24+ ms). We’re not too worried about this yet – first, we just want to see how fast the storage can go regardless of how long it takes to respond, because odds are, it’s not even going to respond fast.
So what do the numbers mean? Well, it depends – this is where everything’s relative. You can compare your drive throughput to storage reviews at Tom’s Hardware. In the example above, my storage only gave me 12 MBs/sec, which sounds atrocious at first – it’s in USB thumb drive territory – but that particular test was the random write test with just 8kb chunks. That’s actually not terribly bad for the size of RAID array I was using at the time.
DISK TESTING ALTERNATIVES: CRYSTALDISKMARK, SQLIOSIM, IOMETER

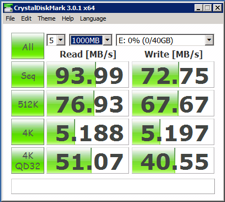
CrystalDiskMark Results
Let’s face it: SQLIO isn’t the easiest tool to use. Sometimes you just want the easy button. Here’s three popular tools that you can use to test the throughput of your storage.
CrystalDiskMark: The easy, free one-button solution (shown).This is about as easy as disk performance testing gets. You download this tool, no installation required, and just click the big All button to start testing. CrystalDiskMark generates sequential & random, read & write loads at your storage system in 512KB and 4KB chunks. This gets you quick answers, but not necessarily SQL-related – after all, SQL Server doesn’t read or write in 512KB or 4KB chunks. It’s an easy start though. Download the portable edition CrystalDiskMark for free here. (To be clear, don’t get the installer version which may come with spyware, and don’t get CrystalDiskInfo.)
Iometer: The open-source, cross-platform tool. If you do a lot of SAN work, you might prefer a cross-platform tool that you can use across all of the clients that connect to the SAN. Iometer works on Windows and Linux. I gotta be honest with you: Iometer isn’t the friendliest tool around. I think it makes SQLIO look easy. Download Iometer free here.
SQLIOSim: Like SQLIO, but really SQL-related. While SQLIO doesn’t really simulate SQL Server IO at all, that’s where SQLIOSim comes in. You can pass in all kinds of parameters to simulate OLTP databases, OLAP databases, Enterprise Edition read-aheads, and much more. Download SQLIOSim for free here, and then get the free SQLIOSim Parser from Microsoft’s Jens Suessmeyer & Jimmy May.
More Tools for Slow SQL Servers
sp_Blitz®: Free SQL Server Health Check – You’ve inherited a SQL Server from somebody, and you have no idea why it’s slow. sp_Blitz® gives you a prioritized list of health and performance issues, plus gives you URLs for more details about each issue.
Our Free 6-Month DBA Training Plan – Every Wednesday, you get an email with our favorite free SQL Server training resources. We start at backups and work our way up to performance tuning.
SQL Critical Care® – Don’t have time to learn the hard way? We’re here to help with our quick, easy process that gets to the root cause of your database health and performance pains. Contact us for a free 30-minute sales consultation.
